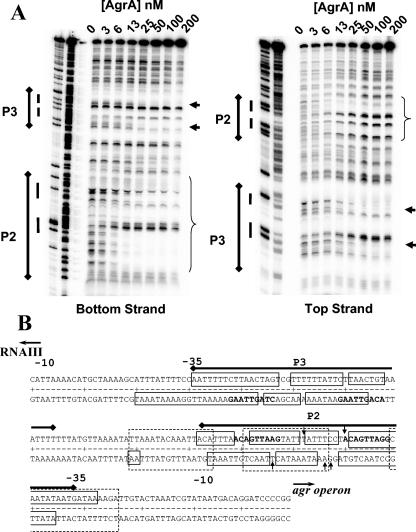
FIG. 2.
(A) DNase I protection assay of increasing concentrations of AgrA against the RNAIII-agr intergenic region (50 pM) without acetyl phosphate. Areas of DNase I protection are indicated by the brackets (P2) and arrows (P3) to the right of the assay lanes. Paired direct repeats in the P2 and P3 promoter regions are indicated by the side bars to the left of the assay lanes. (B) Sequence of the RNAIII-agr intergenic region. The locations of the P2 and P3 promoter regions are indicated by the solid bars above the sequence. SarA-protected areas determined by Rechtin et al. (25) are shown by the dotted-line boxes. The direct repeats conforming to the consensus LytTR recognition sites are indicated in bold type. Protected areas of the P2-P3 promoter region are represented by solid boxes. The approximate locations of residues showing increased sensitivity to DNase I cleavage upon AgrA binding are indicated by vertical arrows.

