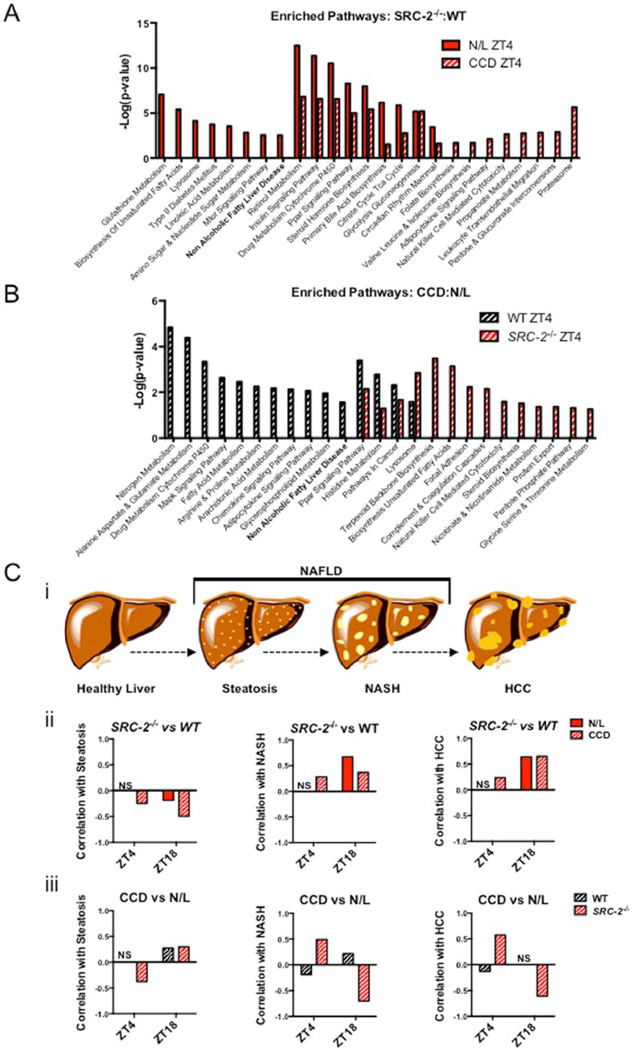
Figure 3.
NAFLD gene expression in the SRC-2−/− CCD model. (A) Gene ontology pathways enriched in liver microarray data from SRC-2−/− mice relative to WT mice at either ZT4 during N/L or ZT4 during CCD. (B) Gene ontology pathways enriched in CCD relative to N/L in ZT4 WT mice or ZT4 SRC-2−/− mice. (C) (i) A schematic representation of NAFLD progression. Pearson r correlation of (ii) SRC-2−/− mice enriched over WT mice during N/L (red) or CCD (red-white) at ZT4 and ZT18 or (iii) CCD enriched relative to N/L in WT (black-white) and SRC-2−/− (red-white) mice at ZT4 and ZT18 compared with human steatosis, NASH, and HCC hepatic microarray datasets (left to right).

