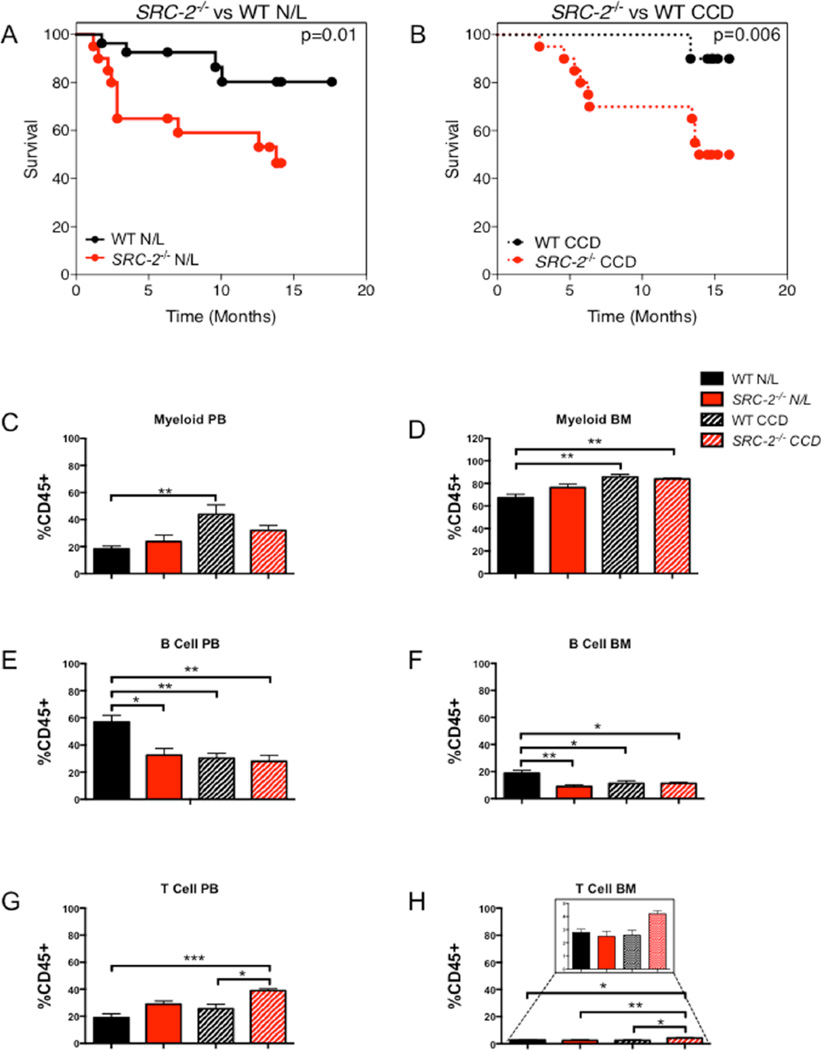
Figure 6.
Loss of SRC-2 results in advanced aging and increased mortality. (A) Kaplan-Meier plot of WT and SRC-2−/− mice mortality rates maintained in N/L conditions. (B) Kaplan-Meier plot of WT and SRC-2−/− mice mortality rates subjected to CCD conditions. (C) Percent of myeloid PB cells in WT and SRC-2−/− mice in N/L or CCD. (D) Percent of myeloid BM cells in WT and SRC-2−/− mice subjected to N/L or CCD. (E) Percent of B-cells in PB in WT and SRC-2−/− mice subjected to N/L or CCD. (F) Percent of B-cells in BM in WT and SRC-2−/− mice subjected to N/L or CCD. (G) Percent of T-cells in PB in WT and SRC-2−/− mice subjected to N/L or CCD. (H) Percent of T-cells in BM in WT and SRC-2−/− mice maintained in N/L or CCD conditions. Data are graphed as the mean ± SEM. *p < 0.05. **p < 0.01. ***p < 0.001. (N = 3–4).

