Figure 2.
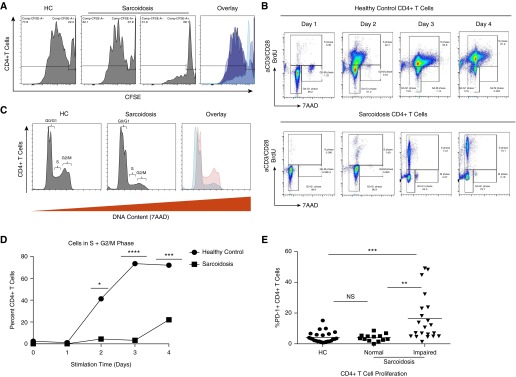
Sarcoidosis CD4+ T cells do not exhibit normal progression into the S phase of the cell cycle. Peripheral CD4+ T cells were TCR stimulated by cross-linking with plate-bound anti-CD3 antibody (Ab) and soluble anti-CD28 Ab. At Day 5 postactivation, cells were fixed and analyzed for CFSE expression by flow cytometry. (A) Representative histograms illustrating proliferation levels after 5-day in vitro stimulation for an HC, as well as a subject with sarcoidosis with normal and one with impaired proliferation. (B–D) CD4+ T cells were cultured with bromodeoxyuridine (BrdU) preceding TCR stimulation for the indicated time points, after which cell cycle progression of five HCs and seven patients with sarcoidosis was analyzed using flow cytometry. Percentages of cells in G0/G1, S and G2/M phase. (E) Percent PD-1 expression in peripheral CD4+ T cells from HCs (n = 25) and patients with sarcoidosis categorized according to their proliferative phenotype (normal [>50%], n = 13; impaired [<50%], n = 21). *P < 0.05, **P < 0.01, ***P < 0.001, ****P < 0.0001; NS, not significant (P > 0.05). 7AAD, 7-aminoactinomycin D.

