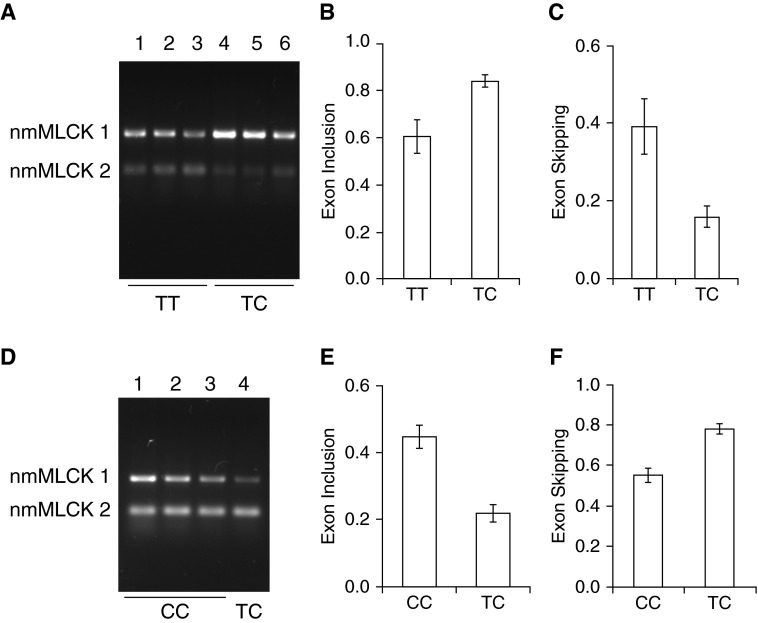
Figure 3.
Effect of rs77323602 and rs147245669 SNPs on MYLK splicing in lymphoblastoid cells. (A) Analysis of SNP rs77323602. Representative gel showing analysis of nmMLCK1 and nmMLCK2 splice variants in lymphoblastoid cells showing that nmMLCK1 levels were increased in lymphoblastoid lines carrying the “TC” genotype. Lymphoblastoid lines GM20334, GM20322, and GM19900 in lanes 1, 2, and 3, respectively, represent the parental alleles (TT) and GM20332, GM19908, and GM19916 in lanes 4, 5, and 6, respectively, represent the “TC” variant. (B and C) Densitometry of RT-PCR analysis shown in A indicating exon inclusion (B) and exon skipping (C). (D) Analysis of SNP rs147245669. Representative gel showing analysis of nmMLCK1 and nmMLCK2 splice variants in lymphoma cells showing that nmMLCK2 levels were increased in the individual carrying the SNP rs147245669. Lymphoma lines GM20760, GM20761, and GM20757 represent the “CC” genotype in lanes 1, 2, and 3, respectively, whereas GM20757 represents the “TC” variant in lane 4. Levels of nmMLCK2 were increased as a result of the SNP rs147245669. (E and F) Densitometry of RT-PCR analysis showing exon inclusion (E) and exon skipping (F). Exon inclusion was defined by nmMLCK1/(nmMLCK1 + nmMLCK2), and exon skipping by nmMLCK2/(nmMLCK1 + nmMLCK2) band intensities. All data were obtained from three independent experiments and are presented as mean ± SE. C/C, cytosine/cytosine; GM, Genome (prefix in the Coriell Institute catalog); T/C, thymine/cytosine; T/T thymine/thymine.

