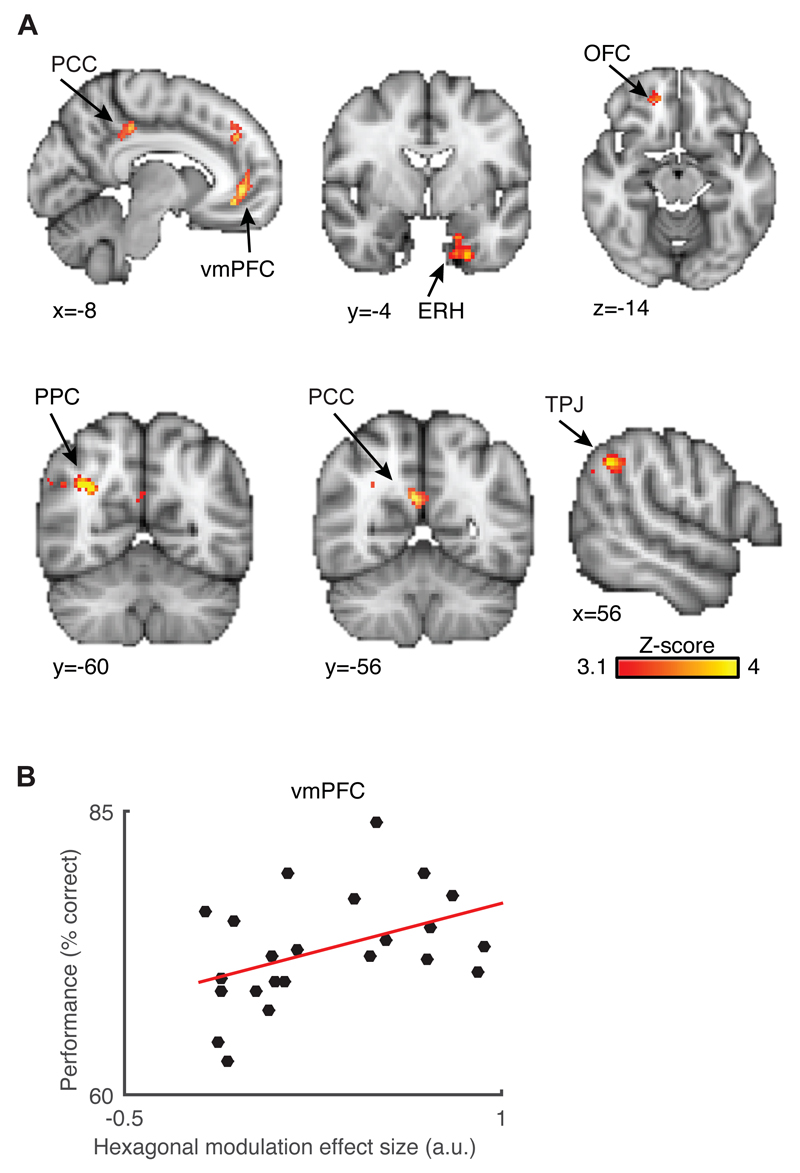
Fig. 2. Identifying hexagonally symmetric signals across the whole brain.
(A) Hexagonal modulation in a network of brain regions including the medial prefrontal cortex, with a peak in its ventral region (vmPFC; peak Montreal Neurological Institute coordinates -8/42/0, peak Z-score = 4.09), the medial entorhinal (ERH; -18/0/-38; Z = 4.41), the orbitofrontal (OFC; 6/44/-10; Z = 4.27), the posterior cingulate (PCC; 0/-32/28; Z = 4.3), retrosplenial (RSC; 6/-52/24; Z = 4.73) and lateral parietal cortices (LPC; 30/-62/28; Z = 4.96) and the temporoparietal junction (TPJ; 52/-42/40; Z = 4.13). For visualization purposes, the maps are cluster corrected at a cluster threshold Z = 3.1 and p < 0.05 for all brain regions apart from the ERH where we used a more lenient threshold of Z = 2.3 and p < 0.05. (B) Subjects who performed better at the task had significantly more hexagonal signal modulation in the vmPFC (correlation coefficient r = 0.432, p = 0.039).

