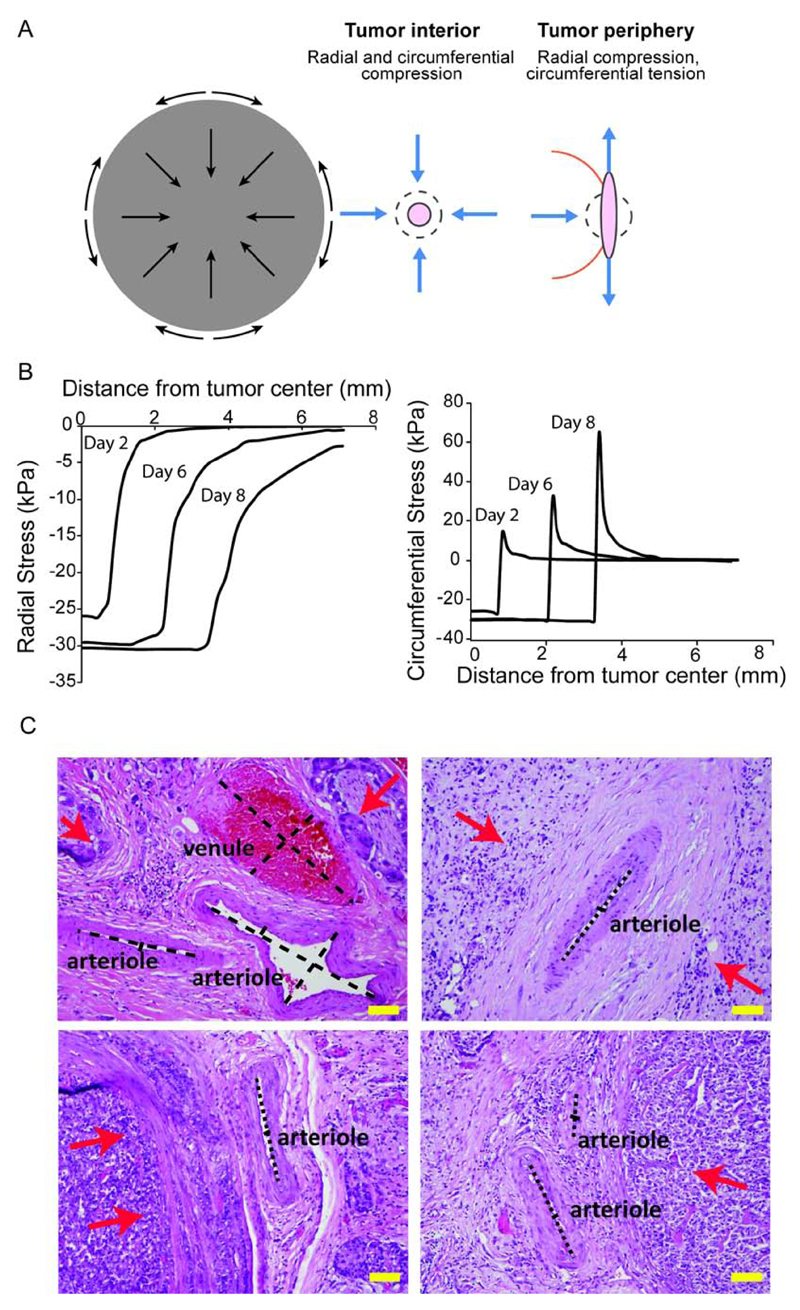
Figure 1.
Externally applied solid stress. A) Schematic of externally applied stress at the tumor center and periphery. B) Mathematical model predictions of the spatial profile of radial and circumferential components of solid stress in tumors. C) Histological sections of human tumors show the deformation of tumor blood vessels. Top: salivary duct carcinoma (left), undifferentiated liposarcoma (right), Bottom: differentiated pancreatic neuroendocrine tumors. Red arrows show tumor location. (scale bar = 100 μm). [Adapted with permission from Reference [6]].

