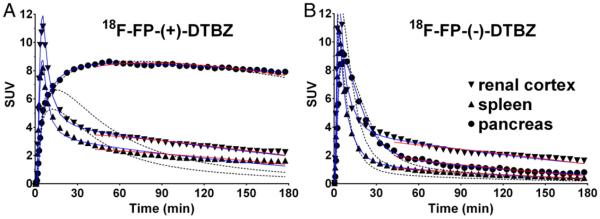
Fig. 3.
Examples of regional time–activity curves in the baboon abdomen for control scans with 18F-FP-(+)-DTBZ (A) and 18F-FP-(−)-DTBZ (B). Curve fittings shown are with one-tissue (black dotted curve) and two-tissue (blue curve) compartment models, as well as the multilinear analysis 1 method (red curve). Radioactivity concentrations are expressed in SUV units (concentration/ (injected dose/body weight)).

