Figure 3.
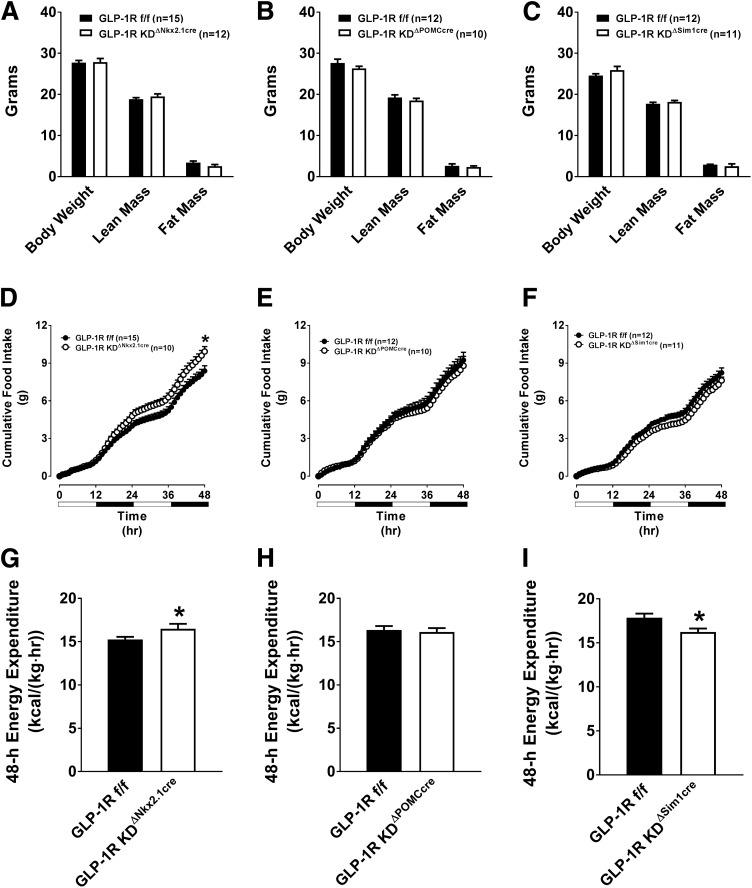
Chow-fed GLP-1RKDΔNkx2.1cre mice exhibit elevated food intake and EE, compared with GLP-1Rf/f controls. The values are mean ± SEM and represent 5-h–fasted body composition (body weight, lean mass, and fat mass), cumulative 48-h food intake, and 48-h EE in GLP-1RKDΔNkx2.1cre (n = 12) (A, D, and G), GLP-1RKDΔPOMCcre (n = 10) (B, E, and H), and GLP-1RKDΔSim1cre (n = 11) (C, F, and I) mice, compared with GLP-1Rf/f controls (n = 12–15). *P < 0.05 vs. GLP-1Rf/f.

