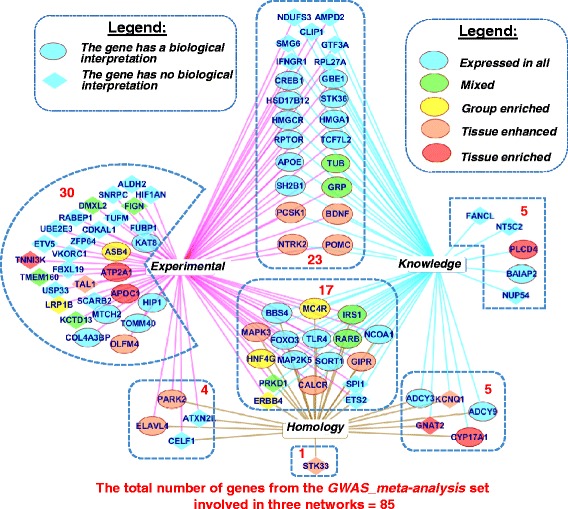
Fig. 10.

Genes from the GWAS meta-analysis set that are involved in three networks (Experimental, Knowledge and Homology). Red numerals indicate the numbers of genes that were found in three, two, or one networks. The colors of nodes correspond to RNA expression categories according to data obtained from the Human Protein Atlas [42] (see Gene expression analysis section). An edge width is proportional to the number of neighbors for the corresponding individual gene/protein in each network
