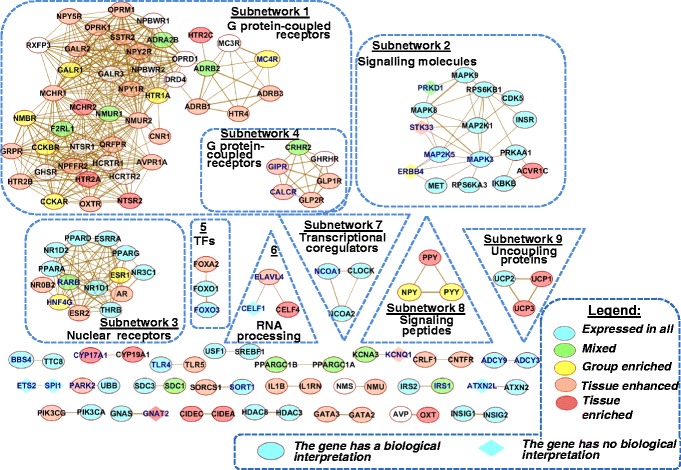
Fig. 8.

Unconnected subnetworks from the network formed by associations between homologous proteins (Homology). The colors of nodes indicate expression categories of genes (see legend) assigned according to data from the Human Protein Atlas [42] (see Gene expression analysis section). Thicker lines represent the stronger associations. Names of genes/proteins from the GWAS meta analysis set are shown in blue. Subnetworks with three or more nodes are outlined by dotted line. TFs – transcription factors
