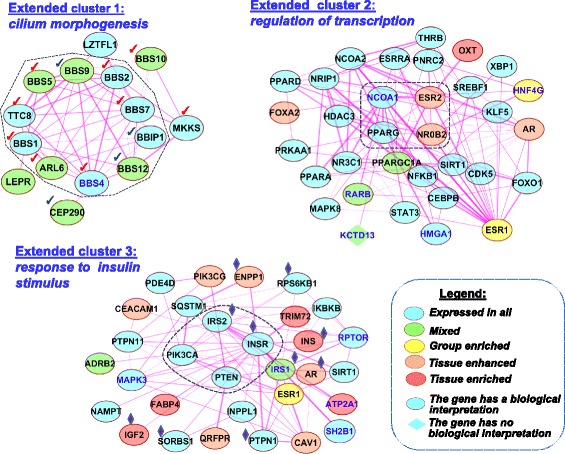
Fig. 9.

Three extended clusters revealed in the network Experimental formed by physical interactions between proteins from the compendium. Dashed lines denote the initial three clusters comprising 10, 4, and 4 proteins, which were identified with the MCODE tool. For Cluster 1: red check marks denote nine proteins annotated by GO term cilium morphogenesis; four genes marked by blue check marks are localized in primary cilia according to [56]. For Cluster 3: blue lozenges mark proteins associated with GO term response to insulin stimulus. Thicker lines represent stronger associations. The color legend and other designations follow Fig. 8
