
Fig. 1.
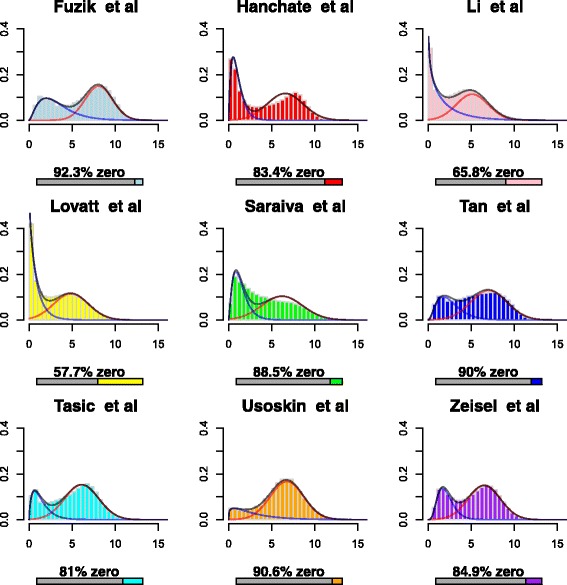
Histograms of log2CPM values of for all genes and cells within each dataset. Zero values are removed from the histograms, and the percentage of zero-values given for each dataset. Black lines represent the mixture model and the other two blue and red colored lines represent the gamma and normal mixture components respectively