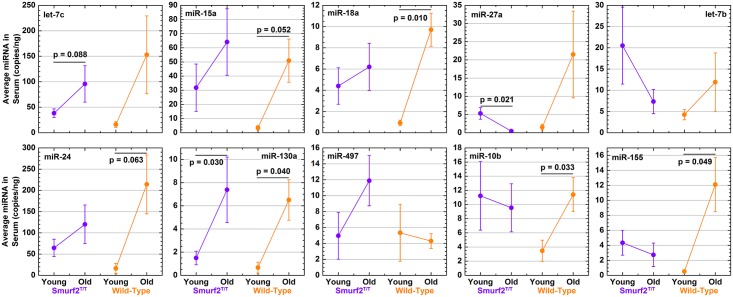
Fig 4. Circulating miRNA signature changing with age in mice susceptible to DLBCL formation compared to wild-type mice.
miRNA was quantified by ddPCR and exact miRNA copies/ng of serum was measured. Average miRNA counts are compared between young and old mice for both Smurf2T/T (purple color) and wild-type (orange) groups. The p-values are indicated on the plots and the error bars in the bar plots represents the standard error.

