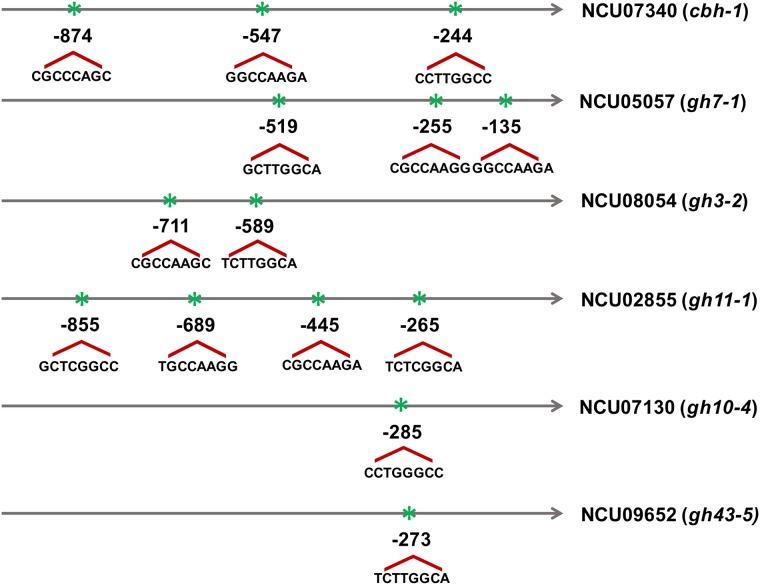
Fig 5. Schematic representation of putative PAC-3 binding sites (5′ -BGCCVAGV-3′).
The analysis was performed using the region 1.0-kbp upstream of cellulolytic and xylanolytic genes. The position of the motifs is relative to the translation initiation codon (ATG). B = C or G or T; V = A or C or G, according to International Union of Pure and Applied Chemistry (IUPAC) norms.

