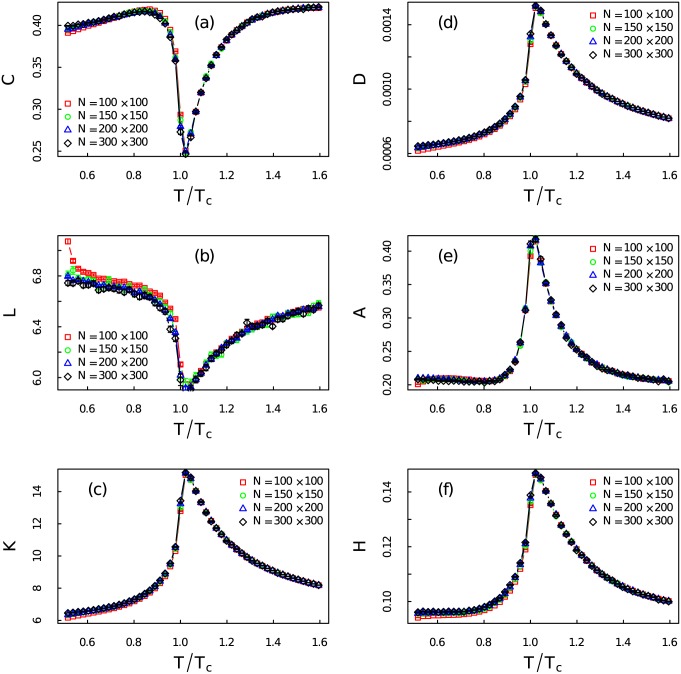
Fig 12. Topological quantities of the visibility graphs.
(Color online) Ensemble average of the topological quantities (a) the clustering coefficient C, (b) the average degree K, (c) the average shortest-path length L, (d) the density D, (e) the assortativity A, (f) the heterogeneity H of networks converted from time series at different temperatures. Different colors and symbols represent different system sizes.

