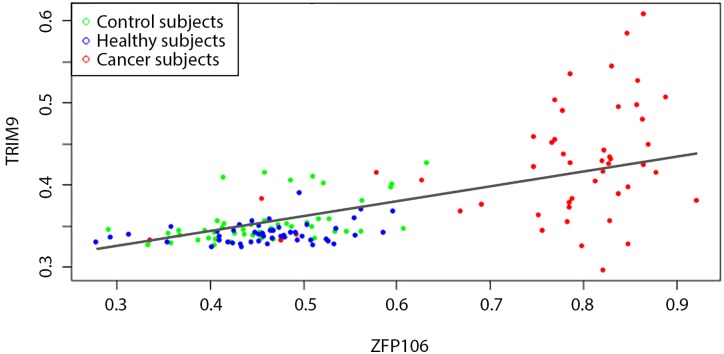
Fig 2. Determining the edge weight between ZFP106 and TRIM9 genes.
Each point corresponds to gene methylation levels in the control group (green), other BRCA-negative (blue) and BRCA-positive (red) subjects. The solid line shows the linear regression model (1). While the data sets for healthy and tumour samples are quite distinct, the mismatch Eq (2) is of the same order of magnitude for both classes. Employing the Mahalanobis distance Eq (3) overcomes this problem.

