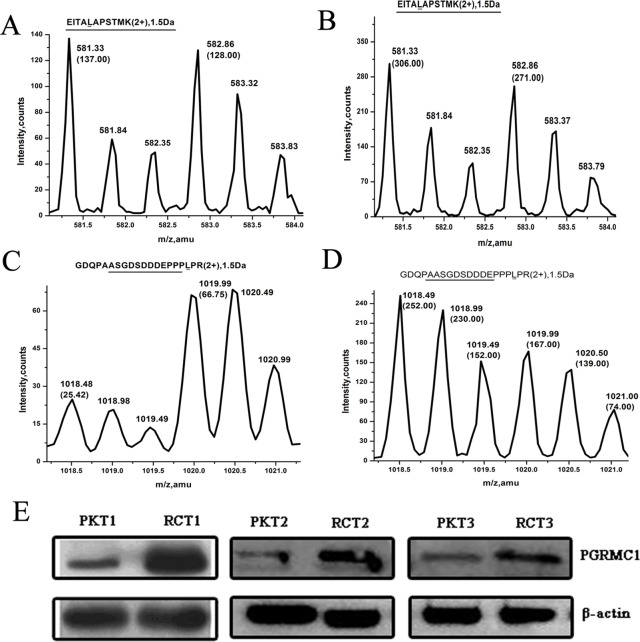
Fig 2. The relative abundance of PGRMC1 compared between RCTs and PKTs.
The SILAC ratios of β-actin with isotope labeling peptides “EITALAPSTMK” (m/z 582.86/581.33, 2+) respectively from the group of protein mixture composed of PKTs and HEK293 cells (A), another group of protein sample containing RCTs and HEK293 cells (B). The isotope labeling peptides ‘GDQPAASGDSDDDEPPPLPR’ (m/z 1019.99/1018.49, 2+) from protein mixture containing PKTs and HEK293 cells (C), RCTs and HEK293 cells (D) were used to quantify PGRMC1 abundance. PGRMC1 concentration was validated between 3 RCTs and corresponding PKTs by western blotting (E). RCTs: renal cell carcinoma tissues; PKTs: para-cancerous kidney tissues.

