
Fig 3.
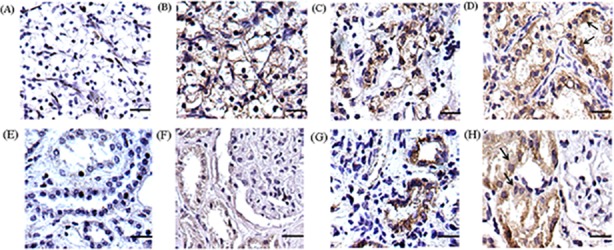
Different staining level and protein distribution of PGRMC1 in RCTs (A-D) and PKTs (E-H). A negative, weak, moderate and strong staining pattern of PGRMC1 was respectively shown in RCTs (A-D) and PKTs (E-H). PGRMC1 mainly located in cytoplasm and cell membrane in RCTs as the arrow indicated (D). PGRMC1 was observed in the cytoplasm of the convoluted tubules in PKTs (H). The scale bar represented 100 μm (original magnification×400).