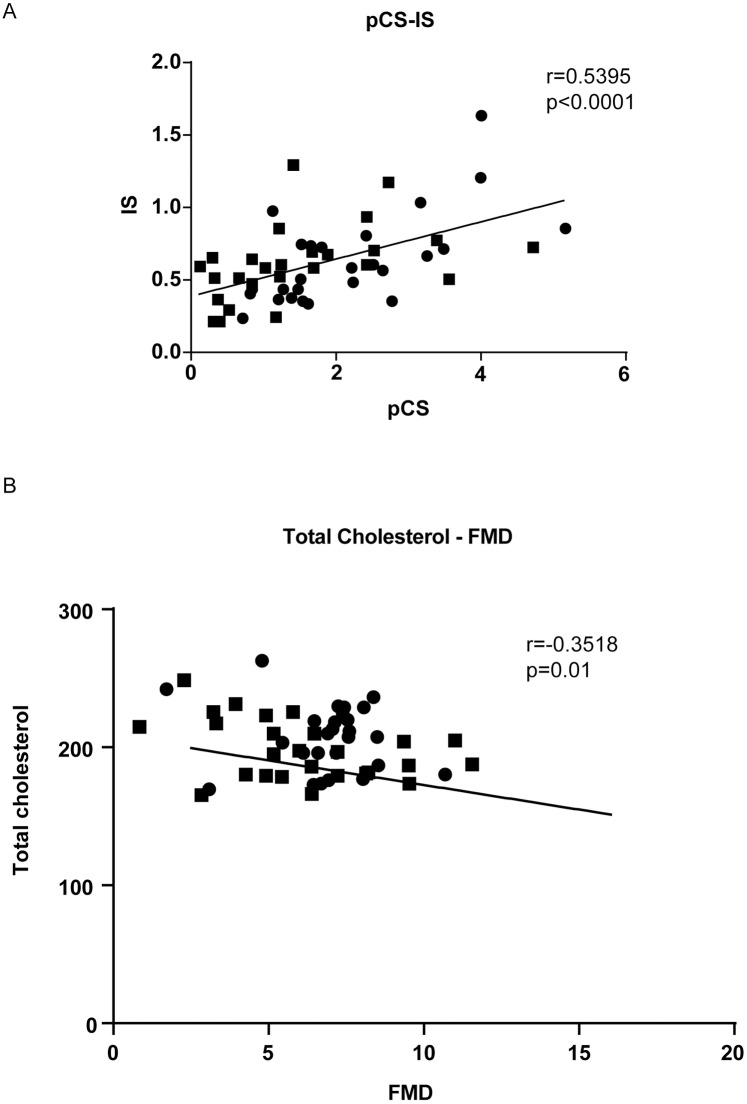
Fig 5. pCS-IS and total cholesterol-FMD correlations.
Graphical representation of the direct correlation between pCS and IS (Fig 5a) and of the inverse correlation between total cholesterol and FMD (Fig 5b). Round and squared points represents T0 and T2 values, respectively. Correlation coefficients and p values are represented in the figure.

