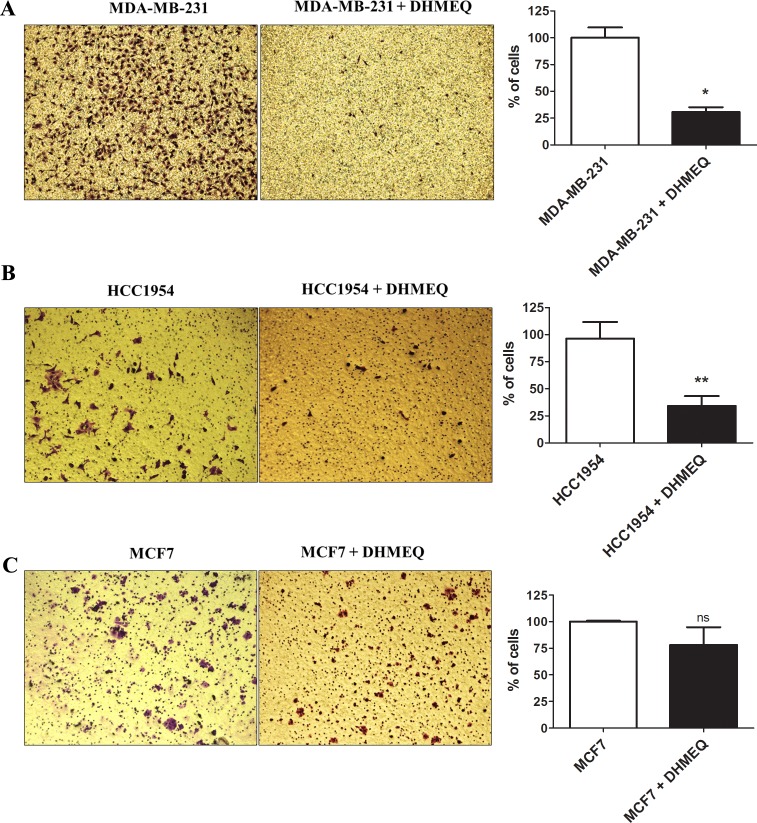
Fig 2. Invasiveness assay.
A representative Matrigel transwell assay evaluating invasive potential at 24 h after DHMEQ treatment of MDA-MB-231 (A) HCC-1954 (B) and MCF-7 (C) cells is shown. The bar graph represents the relative invasive potential of MDA-MB-231, HCC-1954 and MCF-7 cells. The cells were stained with crystal violet. Magnification x200. The data were expressed as the mean ± SD. * = p<0.05, ** = p<0.01, ns = not statistically significant.

