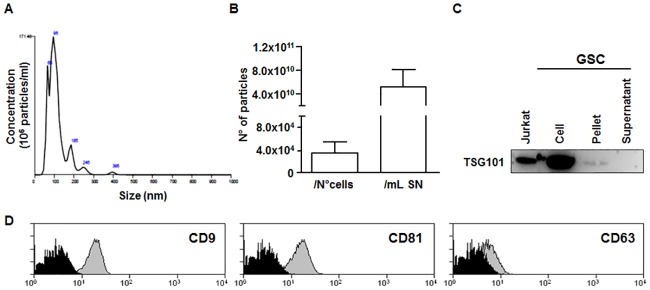
Fig 1. Characterization of exosomes-enriched preparation obtained from GSC.
The NTA was performed on GSC-derived exosomes samples in order to quantify particle concentration normalized for the number of producing cells or millilitre of supernatants. (A) A representative graph of NTA is shown. (B) The data show the amount of exosomes produced by different GSC samples considering either the number of cells counted at the end of the 48 hours culture or the volume of cell supernatants. The data are presented as mean ± SD; n = 7. (C) Immunoblotting of the Jurkat whole cell lysate (positive control), GSC, GSC-derived ExoQuick pellet and supernatant for exosomal surface protein TSG101 (Molecular Weight, 43kDa). (D) Representative FACS histograms of CD9, CD81 and CD63 exosome-specific markers are shown.

