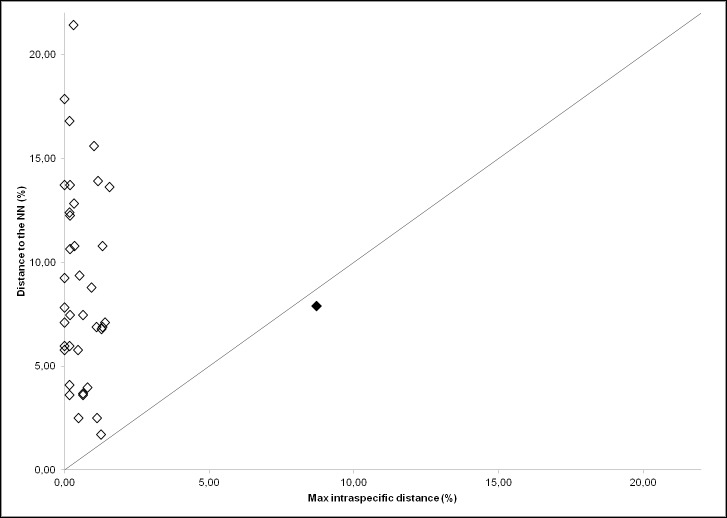
Fig 3. Maximum intraspecific distance plotted against Nearest Neighbour distance (p-distance values) for the COI barcode sequences of the 41 chondrichthyan species.
The black rhombus represents the value for Dasyatis pastinaca before its separation into two sub-clusters 1 and 2. The 1:1 equivalence (straight line) is indicated.

