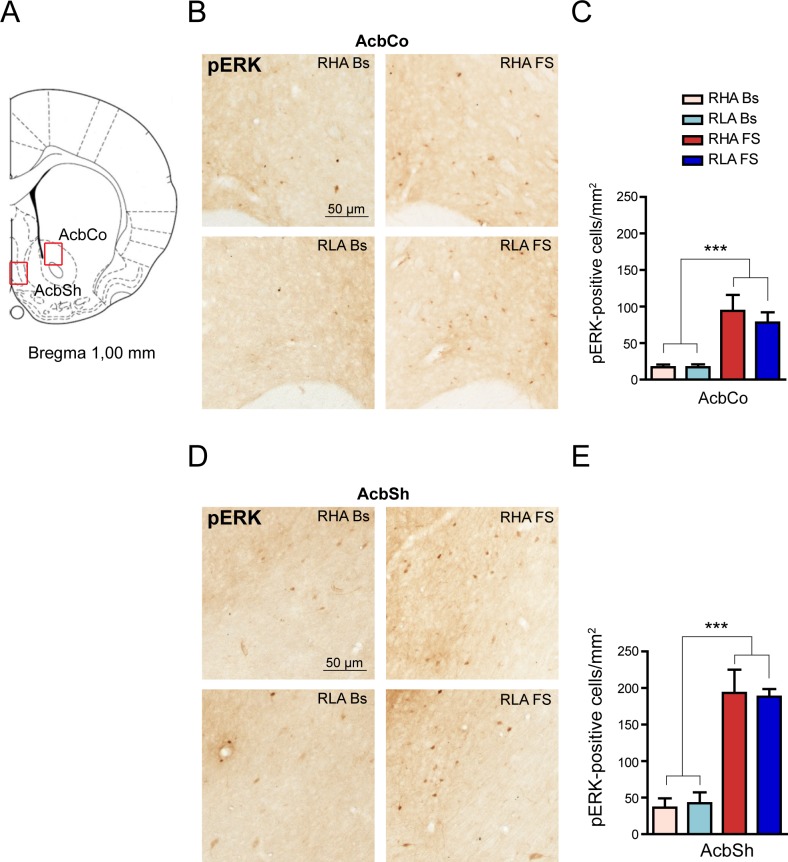
Fig 2. Effect of FS on pERK-immunostaining in the Acb.
(A) The red boxes denote the brain regions where the analyses were performed. The Core (AcbCo) and Shell (AcbSh) subregions were analized separately. (B, D) Representative micrographs of pERK immunohistochemical labeling in the AcbCo (B) and AcbSh (D) oriented as in (A). (C, E) Quantitative analysis of pERK immunostained cell density in AcbCo (C) and AcbSh (E). AcbCo: RHA Bs = 16.9 ± 3.8; RLA Bs = 17.1 ± 0.4; RHA FS = 94.0 ± 20.1; RLA FS = 78.0 ± 12.9; two-way ANOVA: (line) F(1,18) = 0.42, n.s.; (FS): F(1,18) = 32.18, p < 0.0001***; (line x FS interaction) F(1,18) = 0.44, n.s.; Acbsh: RHA Bs = 36.3 ± 12.8; RLA Bs = 42.4 ± 14.8; RHA FS = 193.2 ± 29.1; RLA FS = 188.1 ± 9,7; two-way ANOVA: (line) F(1,18) = 0.00, n.s.; (FS): F(1,18) = 66.07, p < 0.0001***; (line x FS interaction) F(1,18) = 0.09, n.s. Number of animals in each experimental group: RHA Bs, n = 6; RLA Bs, n = 6; RHA FS, n = 5; RLA FS, n = 5. Scale bar = 50 μm.

