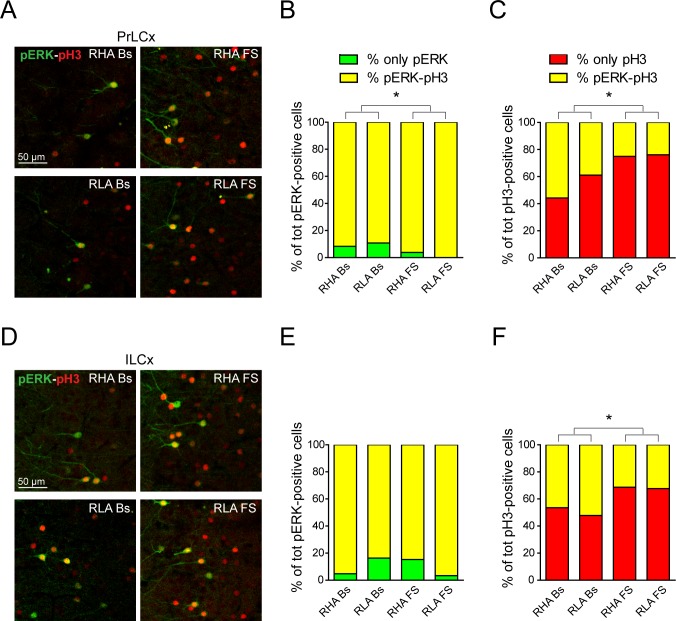
Fig 8. The activation of ERK only partially overlaps with the expression of phosphorylated histone H3 in the PFCx.
(A, D) Confocal micrographs showing double immunofluorescence for pERK (green) and pH3 (red) in the PrLCx (A) and in the ILCx (D). (B, C, E and F) Columns showing the mean percentage of cells labeled exclusively with pERK or pH3 compared to double positive cells in PrLCx (B, C) and ILCx (E, F) across experimental conditions in both Roman rat lines. PrLCx only pERK: RHA Bs = 8.4 ± 2.8%, RLA Bs = 10.8 ± 0.8%, RHA FS = 3.9 ± 2.4%, RLA FS = 0.00 ± 0%; two-way ANOVA: (line) F(1,8) = 0.08, n.s.; (FS) F(1,8) = 9.27, p < 0.03*; (line x FS interaction) F(1,8) = 0.57, n.s.; only pH3: RHA Bs 44.2 ± 14.1%, RLA Bs = 61.2 ± 13.2%, RHA FS = 74.9 ± 5.2%, RLA FS = 76.1 ± 7.6%; two-way ANOVA: (line) F(1,8) = 1.05, n.s.; (FS) F(1,8) = 6.67, p < 0.05*; (line x FS interaction) F(1,8) = 0.79, n.s.; ILCx only pERK: RHA Bs = 4.8 ± 2.9%, RLA Bs = 16.4 ± 0.1%, RHA FS = 15.3 ± 4.3%, RLA FS = 3.4 ± 2.5%; two-way ANOVA: (line) F(1,8) = 0.00, n.s.; (FS) F(1,8) = 0.08, n.s.; (line x FS interaction) F(1,8) = 0.57, n.s.; only pH3: RHA Bs = 53.5 ± 12.7%, RLA Bs = 47.8 ± 7.6%, RHA FS = 68.7 ± 3.0%, RLA FS = 67.7 ± 3.0%; two-way ANOVA: (line) F(1,8) = 0.27, n.s.; (FS) F(1,8) = 7.36, p < 0.02*; (line x FS interaction) F(1,8) = 0.14, n.s.). Number of animals in each experimental group: RHA Bs, n = 3; RLA Bs, n = 3; RHA FS, n = 3; RLA FS, n = 3. Scale bar = 50 μm.

