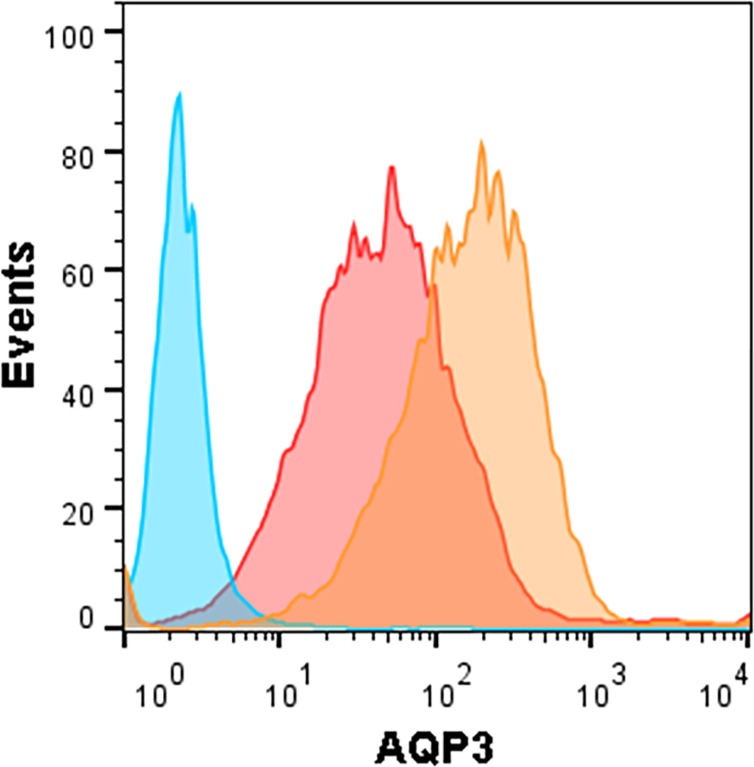
Fig 2. Silencing AQP3 with siRNA reduces AQP expression by a factor of 10 for MIA PaCa-2 cells.
Verification for silencing of peroxiporin AQP3 on the plasma membrane of cancer cells is confirmed by the observed shift in the AQP3 apparent signal. An AQP3 specific signal is shown to exhibit a positive frequency of 91.7 (orange curve) for the unmodified MIA PaCa-2 cancer cells sampled (8,036 cells). After silencing AQP3 for MIA PaCa-2 cancer cells (siAQP3 MIA PaCa-2), the signal shifts to display a positive signal frequency of 59.8 (red curve) for sampled cells (8,067 cells). The peak of the unmodified MIA PaCa-2 cells (orange) displays an average positive signal around 200 whereas the siAQP3 MIA PaCa-2 cells (red) displays an average around 20. This shift in AQP3 signal demonstrates a decrease by a factor of 10 in AQP expression for the silenced MIA PaCa-2 cells when compared to unmodified MIA PaCa-2. The blue curve is the negative IgG control. Data were generated by immunofluorescence tagging, detection through flow cytometry, and analyzed through FlowJo (Treestar, Inc., Ashland, OR, USA).

