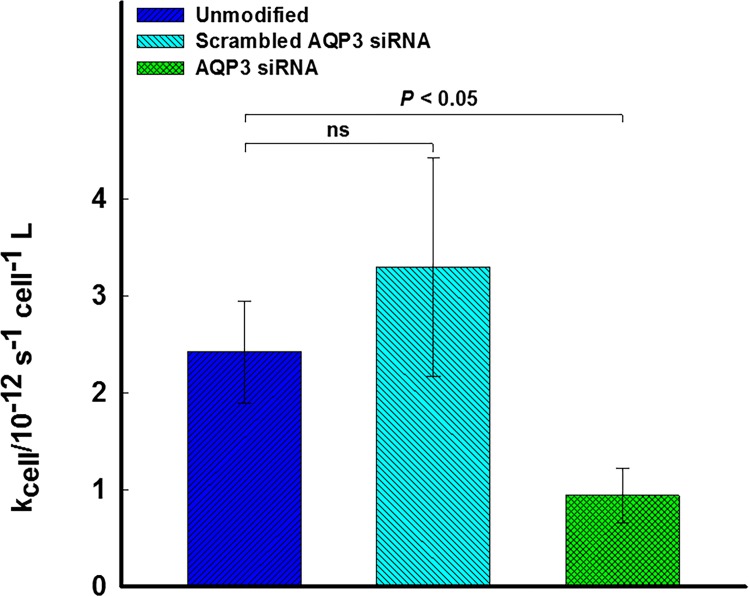
Fig 3. Silencing AQP3 on MIA PaCa-2 cancer cells decreases the rate of H2O2 uptake per cell.
The rate of H2O2 uptake by per cell is displayed for MIA PaCa-2 (blue) and siAQP3 MIA PaCa-2 (green). There is a significant decrease in rate between MIA PaCa-2 and siAQP3 MIA PaCa-2 cells (P = 0.002, n = 4). The rate of H2O2 uptake for the negative control (scrambled MIA PaCa-2, cyan) is not significantly different from MIA PaCa-2 (P = 0.41, n = 4) confirming that the silencing method is not affecting the results. P-values are displayed for cases that are significantly different and are determined through ANOVA analysis. Error bars displayed represent the propagated error.

