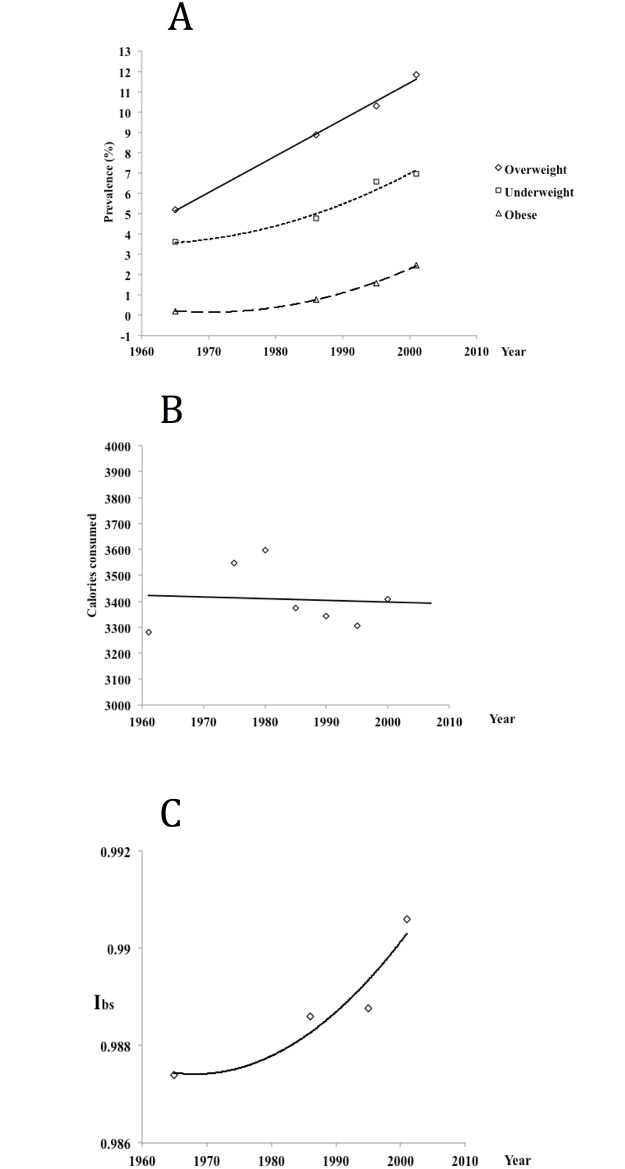
Fig 3. A—changes in the prevalence of overweight (BMI 25.0–29.9 kg/m2) obesity (BMI> 30 kg/m2) and underweight (BMI < 18.5 kg/m2) among Polish conscripts (19 year old males) from 1965 to 2001, B—the average caloric intake in Poland during the same period, C—values of the Biological State Index (Ibs) in Poland in the same period.
All data from [33] except for own calculations of the Ibs values.

