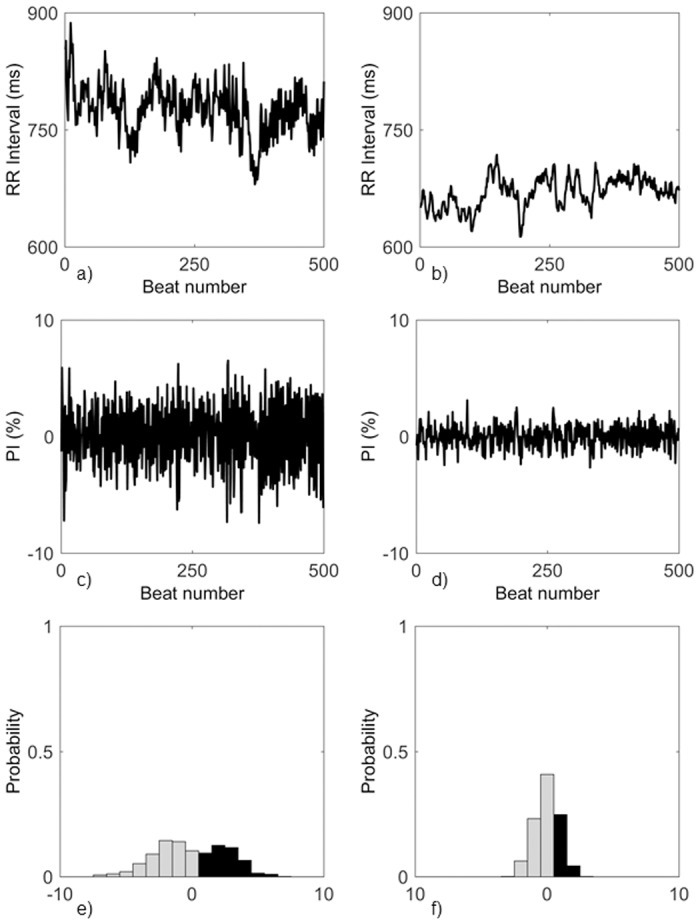
Fig 1. Deriving probability and histogram from RR intervals.

RR interval data from a CONT patient (a) and a DPNn patient (b), their PI (c,d) and PI histogram (e,f).

RR interval data from a CONT patient (a) and a DPNn patient (b), their PI (c,d) and PI histogram (e,f).