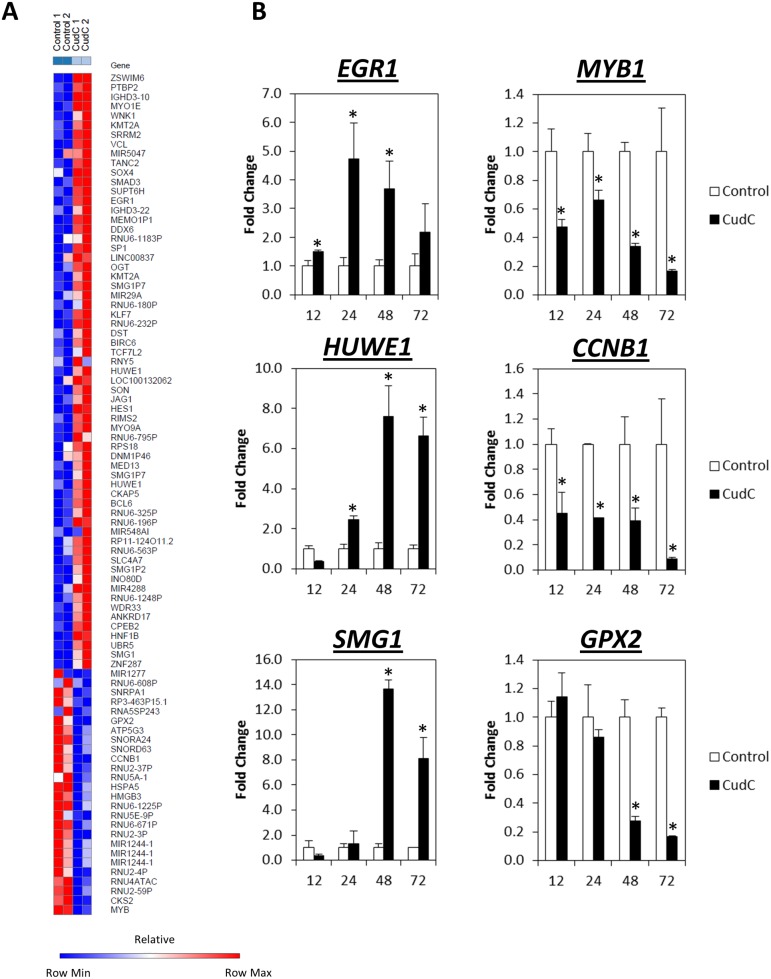
Fig 2. Differential gene expression regulated by cudraflavone C in Caco-2 cells.
(A) Heatmaps generated based on the genes regulated by Cud C. Caco-2 cells were exposed to 10 μM Cud C for 48 hours. GeneChip® Human Transcriptome Array 2.0 (Affymetrix, USA) was applied. Gene expression changes that ≥2-fold were considered significant. Control 1 and Control 2 represent gene expression from cells treated with vehicle control (1% DMSO); Cud C 1 and Cud C 2 were gene expression from cells treated with Cud C (10 μM). (B) qPCR was used to validate the microarray data. Caco-2 cells were exposed to 10 μM Cud C for 12, 24, 48 or 72 hours The left and right panels present genes that are up and down-regulated respectively. All data represent the mean ± s.d. from at least three independent experiments. Symbol “*” indicates the statistical significance concluded from Student’s independent t-test with p-value ≤0.05.

