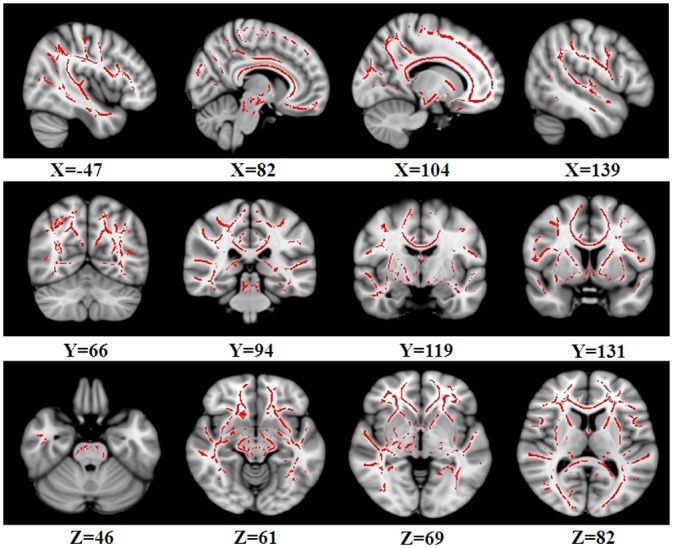
Fig 1. Regions showing significant FA differences among NC, aMCI-s and aMCI-m based on ANCOVA.

The threshold was set at a TFCE-corrected P-value of less than 0.01 and a minimum cluster size of 50 contiguous voxels. Left is the left.

The threshold was set at a TFCE-corrected P-value of less than 0.01 and a minimum cluster size of 50 contiguous voxels. Left is the left.