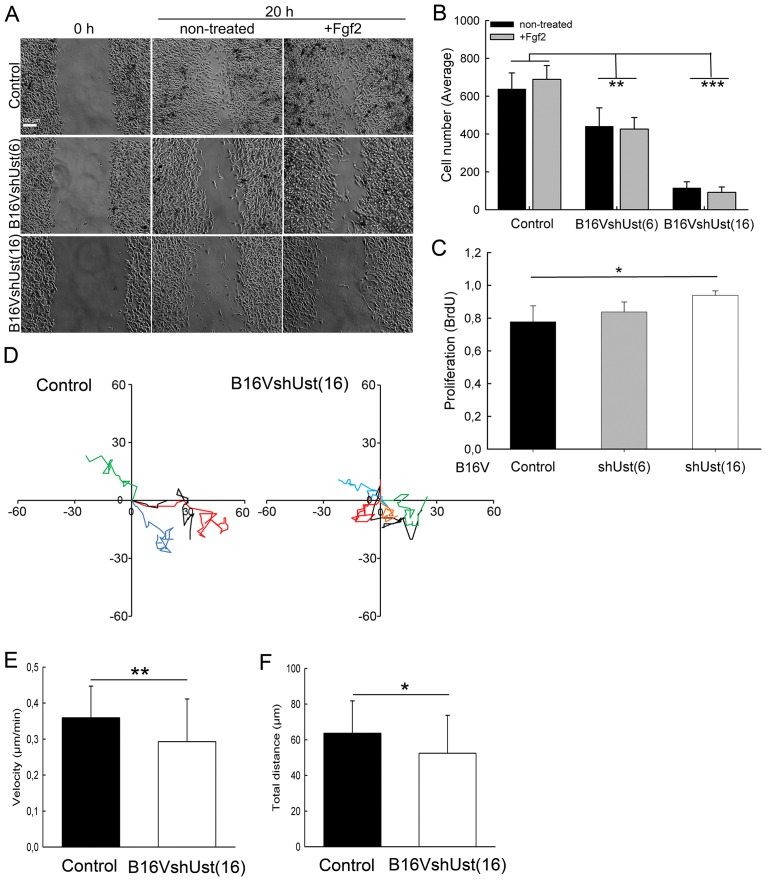
Fig 2. Migration of B16 melanoma cell lines.
(A) Scratch assays were performed on B16V control, B16VshUst(6) and B16VshUst(16). Confluent cells were starved and wounded prior to Fgf2 treatment. Representative pictures are shown for 0 and 20h (Bar = 100 μm). (B) Quantification of the wound scratch assay shown in (A). Data are expressed as a mean±SD of three independent experiments (n = 8 for each condition). (C) Proliferation of the B16V cell lines measured by BrdU incorporation for 20h. (D) Paths of four migrating cells of B16V control and B16VshUst(16) evaluated by time lapse-microscopy. (E) Quantifications of the migration of control and B16VshUst(16) velocity (Supporting Information S3 and S4 Figs) and (F) total distance covered on murine wild-type fibroblast matrices (three independent experiments, mean±SD, 32 control cells and 54 B16VshUst(16) cells, *, P<0.05, **, P<0.01, ***, P<0.001).

