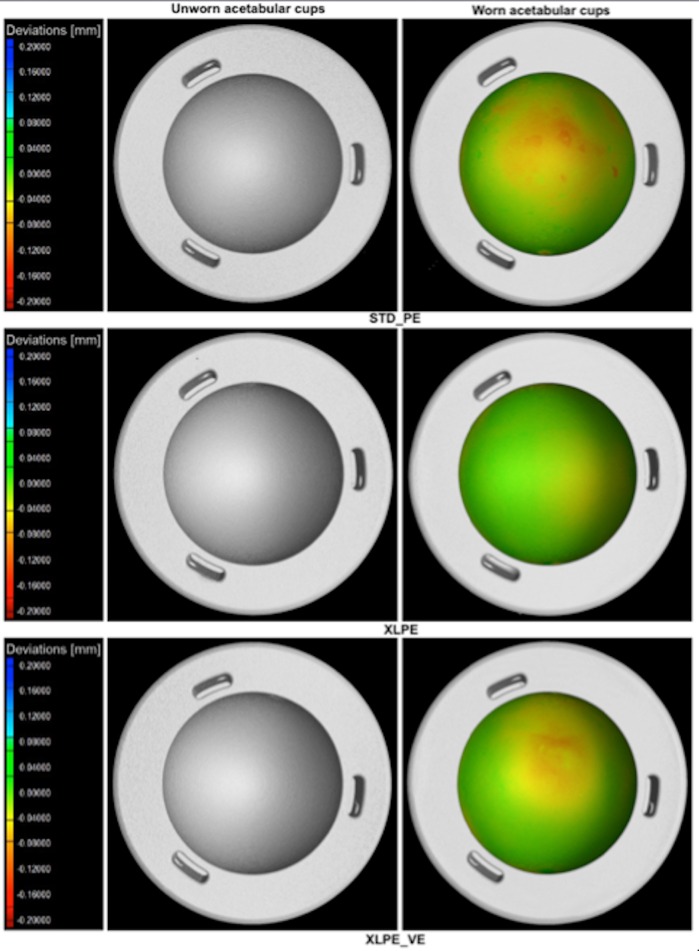
Fig 2. CT reconstructed 3D models of three examples of acetabular cups (one per each material type) obtained by micro-CT scanning at time T = 0 (on the left of the picture) and corresponding wear maps at two millions of cycles (on the right of the picture).
The chromatic scales (on the left) indicate the deviations, in mm, between the CT measurements obtained before and after wear; i.e. they represent local wear.

