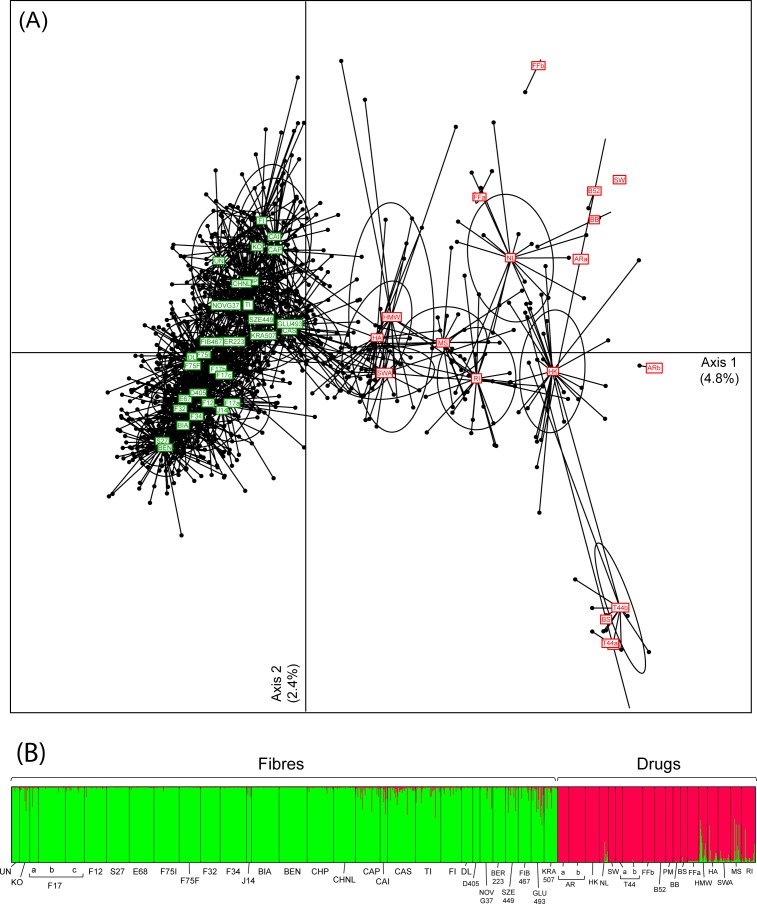
Fig 1.
Principal Component Analysis (A) and Bayesian clustering with STRUCTURE (B) of individual genotypes from 48 Cannabis accessions. Fibre and drug accessions are displayed in green and red respectively on the PCA. Ellipses illustrate 80% inertia of each accessions. Dots represent individuals, linked to their accessions (labelled within colored squares). On the STRUCTURE barplots, colors show the probability of assignment to each cluster (K = 2), perfectly distinguishing fibres from drugs.

