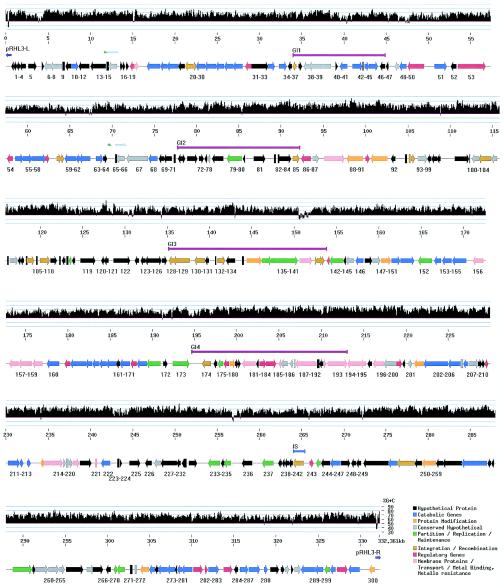
FIG. 5.
Physical map and G+C content of pRHL3. The G+C content is depicted in a histogram in which each vertical bar indicates the G+C composition calculated over a 100-bp interval by using a sliding window of 10 bp. The bottom bar depicts predicted ORFs grouped into eight functional categories (a color code is provided in the lower right corner of the figure). The orientation of each ORF is indicated by an arrowhead. The symbols between the upper and lower bars indicate the respective positions of genomic islands (GI1 to -4; fuchsia-colored bars), IS elements (light blue bar), TIRs (dark blue arrows), and possible duplications (light blue and green arrows).

