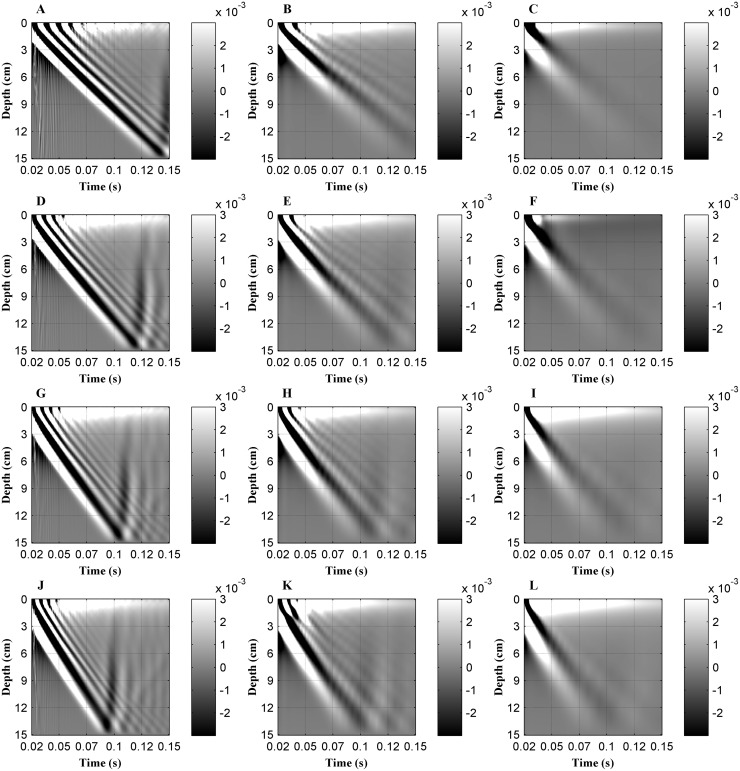
Fig 2. Axial displacement, produced by an external mechanical vibration, measured along the scanning line in the liver tissue model as a function of time (0.02s to 0.15s after excitation).
The following combinations of Young's modulus (E) and viscosity (μ2) were used for simulations: (A) 4 kPa+0 Pa·s, (B) 4 kPa +1 Pa·s, (C) 4 kPa+4 Pa·s, (D) 6 kPa+0 Pa·s, (E) 6 kPa+1 Pa·s, (F) 6 kPa+4 Pa·s, (G) 8 kPa+0 Pa·s, (H) 8 kPa+1 Pa·s, (I) 8 kPa+4 Pa·s, (J) 10 kPa+0 Pa·s, (K) 10 kPa+1 Pa·s and (L) 10 kPa+4 Pa·s, respectively.

