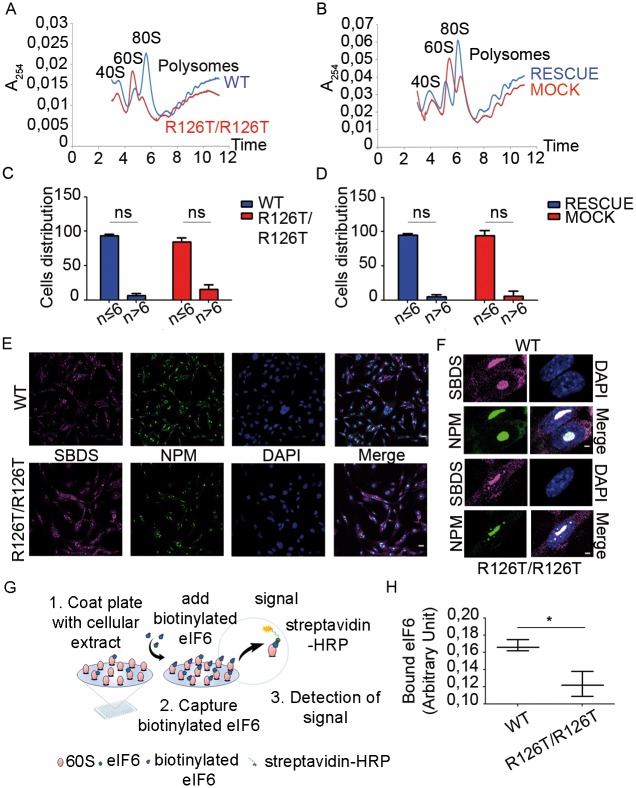
Fig 2. SBDS deficiency reduces the maximal translational capability up to 70% due to a defect in 60S maturation that is partly associated with a change in eIF6–free 60S subunits.
(A-B) Polysome profiles. SbdsR126T/R126T cells show an increase in free 60S and lower 80S peaks on sucrose gradient compared to wt (A). The phenotype is completely restored in SbdsRESCUE cells (B). Note, the increase of free 60S is two-fold. A254 nm was measured after 15–50% sucrose gradient sedimentation. Representative experiment of n≥5. (C-D) Nucleoli analysis. SbdsR126T/R126T (C) and SbdsMOCK cells (D) do not have differences in the number of nucleoli respect to their control cell lines (wild type and SbdsRESCUE). Distribution of cells containing less or more of six nucleoli per nucleus in wild type, SbdsR126T/R126T, SbdsRESCUE and SbdsMOCK cells was counted with Volocity Sofwtare, by analyzing cells stained for the nucleolar marker nucleophosmin (NPM) (n≥200, n = number of nuclei analyzed per genotype). (E-F) SBDS and NPM localization. Confocal images wild type and SbdsR126T/R126T cells indicate a co-localization of SBDS and NPM proteins within the nucleolus, and a cytoplasmic SBDS. There are no visible differences among all genotypes. Scale bar 25 μm (E) and 2 μm (F). (G-H) Measurement of eIF6 binding sites by iRIA technique shows that wt cells have 25% more free 60S as detected by eIF6 binding. (G) iRIA technique outline: SbdsR126T/R126T and wild type cellular extracts were immobilized on a 96 well and biotinylated eIF6 is added. This assay is able to detect the binding between eIF6 and 60S. (H) SbdsR126T/R126T fibroblasts have less binding sites for eIF6, respect to wild type cell line, i.e. 0.12 arbitrary units versus 0.16. Representative technical triplicate experiment of n≥4 biological replicates.

