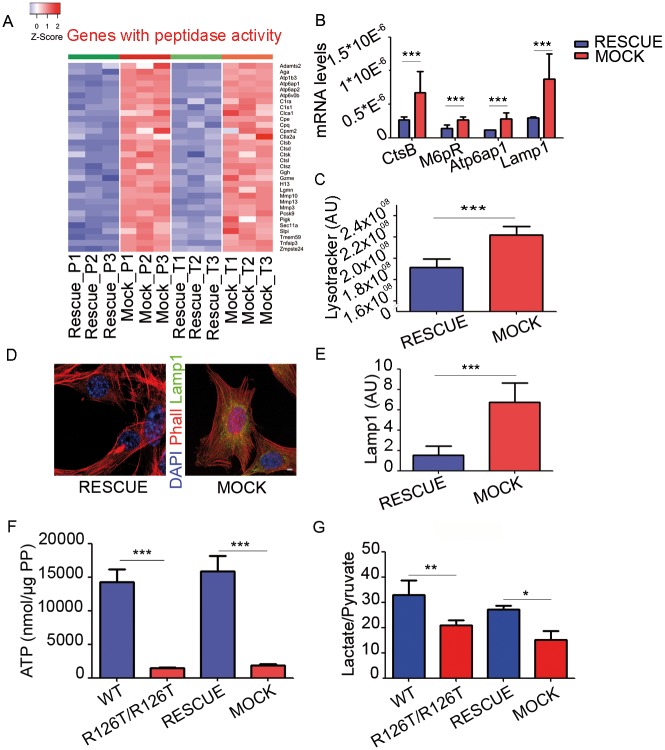
Fig 5. SBDS mutation results in increased lysomome trafficking and activity, and a decrease in ATP and lactate levels predicted by changes in the steady-state of the mRNAs identified by RNA-seq.
(A) Changes in the steady-state levels (total, bona fide for transcriptional) of genes with peptidase activity as detected both on polysomes and total. Heat maps representing absolute gene expression levels in SbdsMOCK and SbdsRESCUE samples for the subset of gene sets with peptidase activity by Gene Ontology analysis. (B) qPCR validation of selected genes associated to lysosome activity. Real time analysis of selected genes associated to lysosome trafficking and activity. Data shown for n≥3; mean±s.d., T-test, paired, two-tailed. (C) SbdsMOCK cells have a decrease in intracellular pH value. Representative graph showing increased lysotracker fluorescence intensitity in SbdsMOCK cells respect to SbdsRESCUE cells. This result suggests more lysosome trafficking and activity in SbdsR126T/R126T cells. Data shown for n≥3; mean±s.d., T-test, paired, two-tailed. (D-E). Lamp1 immunostaining (representative cells, D) and quantitation (E). Scale bar indicates 8.3μm. Globally, A-E show increase in the proteolitic potential of SbdsMOCK respect to SbdsRESCUE cells. (F-G) SBDS levels positively regulate ATP accumulation (F) and lactate/pyruvate production, an index of glycolysis (G). All graphs represent mean ± s.d. Statistic applied was T-test, paired, two-tailed, n≥4.

