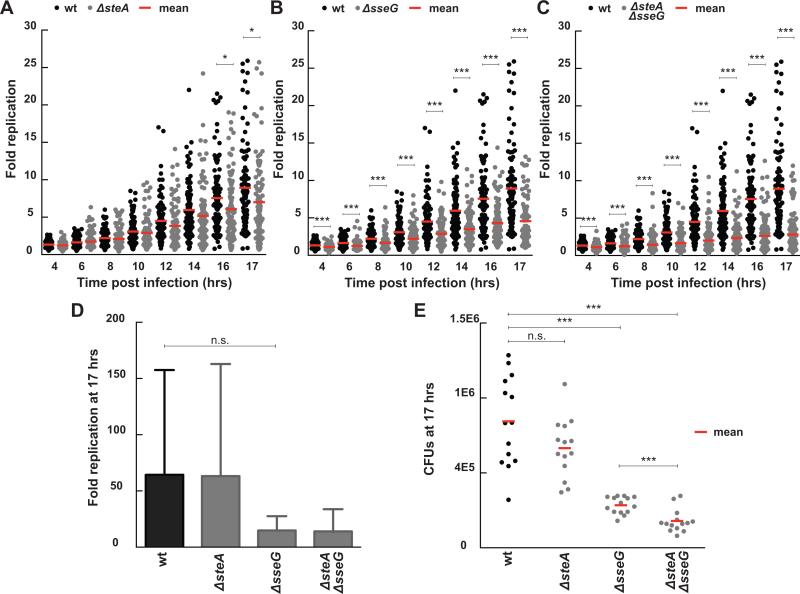
Figure 3.
Fold change in bacterial load for infections with ΔsteA, ΔsseG, and ΔsteA/ΔsseG strains compared to wt Salmonella. Results compare single cell long term imaging assays (A-C) with CFU assays (D-E). For the single cell imaging assays, fold replication was calculated by dividing the bacterial area in pixels at discrete time points by the bacterial area at three hours post infection. Each dot represents the fold replication within a single cell. (A) ΔsteA infections exhibit decreased fold replication compared to wt infections at late time points (wt n= 100 cells, ΔsteA n= 99 cells, 3 independent experiments, * indicates p <0.02). (B) ΔsseG infections exhibit decreased fold replication compared to wt infections at all time points (ΔsseG n= 98 cells, 2 independent experiments, *** indicates p <0.0002). (C) ΔsteA/ΔsseG infections exhibit decreased fold replication that is additive between the two single knock out strains (ΔsteA/ΔsseG n= 116 cells, 3 independent experiments, *** indicates p <0.0003). (D) Fold replication as measured by a CFU assay (n = 3 independent experiments, n.s. signifies p = 0.09). Fold replication for the CFU assay was calculated by dividing the CFUs at 17 hours post infection by the CFUs at 3 hours post infection. Values are the mean + 95% confidence interval. (E) CFUs at 17 hours post infection show decreased bacterial load for ΔsseG and ΔsteA/ΔsseG. Each dot represents CFUs from a single infection (n=14 for all strains; data from three independent experiments, *** signifies p=0.0003, n.s. signifies p = 0.07). All p values were calculated using a one-way ANOVA test (KaleidaGraph).

