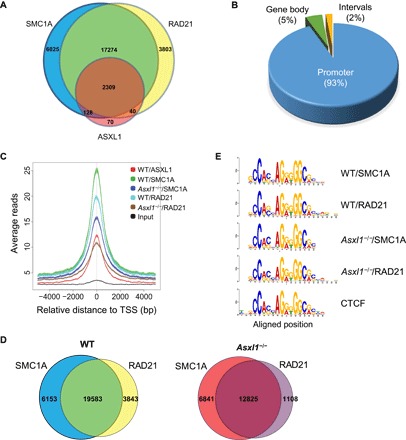
Fig. 4. Loss of Asxl1 leads to a decreased cohesin occupancy on the genome but does not affect their DNA recognition sequence.

(A) Venn diagram showing overlapping peaks between ASXL1, SMC1A, and RAD21 ChIP-seq in WT LK cells. (B) Genomic distribution of ASXL1/SMC1A/RAD21 triple overlapping ChIP peaks in WT LK cells. (C) The overlap analysis shows the peak reads in WT and Asxl1−/− LK cells based on ASXL1/SMC1A/RAD21 overlapping peaks from WT LK cells. Zero base pair (bp) is defined as the peak of ASXL1 binding sites on the genome of WT LK cells. Decreased genomic cohesin complex occupancy is seen in Asxl1−/− LK cells. The overlap peaks of SMC1A and RAD21 represent the cohesin occupancy on the genome. Comparison of the SMC1A/RAD21 overlapping peaks between WT and Asxl1−/− LK cells identified 7833-peak loss and 1175-peak gain in the Asxl1−/− LK cells. TSS, transcription start site. (D) The pie chart represents the percentage of genes with no cohesin occupancy change (remain) or cohesin loss (SMC1A and/or RAD21 peak loss) in Asxl1−/− BM LK cells based on all ASXL1/SMC1A/RAD21 triple overlapping peaks of WT LK cells. (E) DNA recognition sequence of SMC1A and RAD21 in WT or Asxl1−/− LK cells. The SMC1A and RAD21 recognized identical DNA motif as CTCF.
