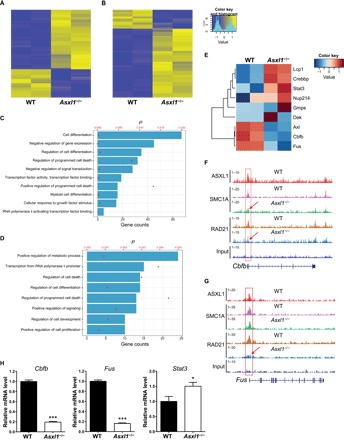
Fig. 5. ASXL1 regulates gene expression via the cohesin complex in LK cells.

(A) The heatmap shows the differentially expressed genes associated with loci of no changes in SMC1A and RAD21 occupancy in Asxl1−/− BM LK cells. (B) The heatmap shows the differentially expressed genes associated with loss of SMC1A and/or RAD21 in Asxl1−/− BM LK cells. (C) The GO analysis of the 237 up-regulated genes (of the ~1600 genes with loss of RAD21 and/or SMC1A occupancy in Asxl1−/− LK cells) in Asxl1−/− LK cells compared to the WT LK cells. (D) GO analysis of the 65 down-regulated genes (of ~1600 genes with loss of RAD21 and/or SMC1A occupancy in Asxl1−/− LK cells) in Asxl1−/− LK cells compared to the WT LK cells. The P values of each GO term are represented by the red dots, and the gene set counts are represented by the bars. (E) Heatmap of differentially expressed genes of myeloid malignancy relevance within Asxl1/SMC1/RAD21 overlapping loci in Asxl1−/− LK cells. (F and G) Genome browser tracks of the Cbfb and Fus locus with overlapping ASXL1, SMC1A, or RAD21 peaks. (H) Relative RNA level of Cbfb, Fus, and Stat3 in LK cells as determined by qPCR. Data are represented as means ± SEM from three independent experiments. ***P < 0.001 and **P < 0.01.
