
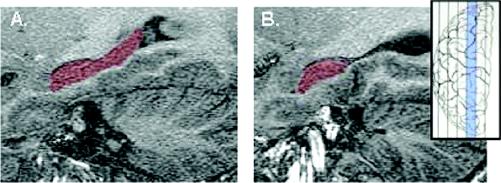
Fig. 2: Magnetic resonance spectroscopic images of the left hippocampus in a healthy control subject and in a patient with recurrent depression. The size of the difference shown here is unusually large, with most positive studies reporting a reduction in hippocampal complex (HC) volume of about 15% between cases and controls.78 Insert shows in blue the approximate sagittal level of the HC. Images were acquired on a 1.5-T GE Sigma Genesis–based EchoSpeed imager using previously published parameters.79
A: Sagittal view of the left HC, highlighted in red, of a healthy control subject whose left HC volume measured 3295 mm3.
B: The patient whose left HC is represented here, with an HC volume of 2015 mm3, was of the same age and sex as the control subject but had a long history of recurrent depression.