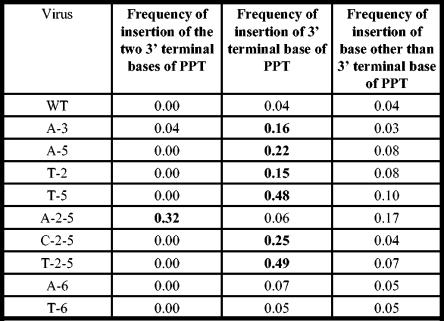
FIG. 3.
Frequencies of insertion of the terminal base and terminal two bases of the PPTs. The mutants chosen for this analysis either showed significant increases in the frequency of insertion or had a modification in the terminal nucleotide of the PPT. The viruses are shown in the left column, the frequencies of insertion of the two terminal nucleotides are shown in the second column, the frequencies of insertion of the 3′ terminal nucleotide are shown in the third column, and the frequencies of insertion of nucleotides other than the terminal nucleotide of the PPT for each mutant are shown in the right column. The A-6 and T-6 mutants did not have statistically significant increases in the frequency of insertion of one or two nucleotides, but the other mutants in the figure did have statistically significant increases in the frequency of insertions at the 2-LTR circle junctions.

