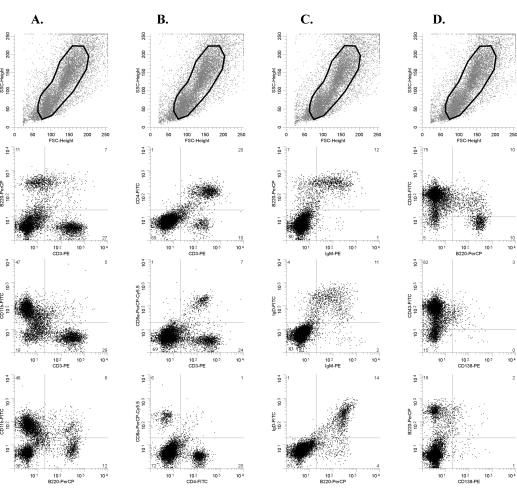
FIG. 4.
Flow cytometry data from an SL3-3dm-induced tumor with the CD11b+ phenotype. Dot plots show results after staining with fluorochrome-conjugated antibodies to CD3-B220-CD11b (A), CD3-CD4-CD8a (B), B220-IgM-IgD (C), and B220-CD43-CD138 (D) of cells from the spleen tumor of a mouse (no. 498-2) diagnosed with myeloid leukemia with maturation. The region used for gating is also indicated (top panel of each column). FSC, forward scatter; SSC, side scatter.

