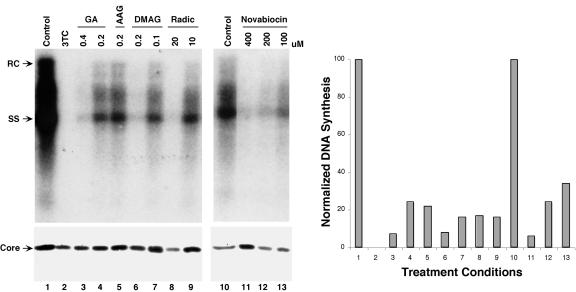
FIG. 2.
Inhibition of HBV DNA synthesis by Hsp90 inhibitors. The levels of HBV DNA synthesis were measured by Southern blot analysis of viral replicative intermediates extracted from HepAD38 cells following treatment with the various inhibitors as indicated (left panel, top). The levels of HBV core protein in cellular extracts prepared from the same cells were measured by Western blot analysis using an anti-HBV core antibody (left panel, bottom). RC, relaxed circular DNA; SS, single stranded DNA; Radic, radicicol; AAG, 17-AAG; DMAG, 17-DMAG. Levels of HBV DNA were normalized to the core protein levels at each treatment condition and are expressed as a percentage of the control untreated culture (right panel). The numbers on the right and left panels each represent the same treatment conditions.

