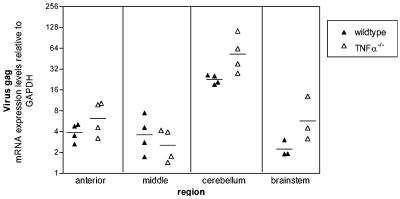
FIG. 6.
Viral gag mRNA expression in EC virus-infected wild-type and TNF-α−/− mice. Brains were dissected into four regions as shown in Fig. 5A. Viral gag mRNA expression was determined by real-time PCR with triplicate wells for each sample. Data are shown as the fold expression of the gene of interest relative to that of the gene for GAPDH as described in Materials and Methods. Each symbol represents a single animal; filled triangles represent EC virus-infected wild-type mice, while open triangles represent EC virus-infected TNF-α−/− mice. Brains were removed at 21 days postinfection. Statistical analysis was performed with a two-tailed Mann-Whitney test for each brain region. The P value between EC virus-infected wild-type versus EC virus-infected TNF-α−/− mice was P = 0.4 for the anterior, 0.5 for the middle, 0.029 for the cerebellum, and 0.1 for the brain stem region.

