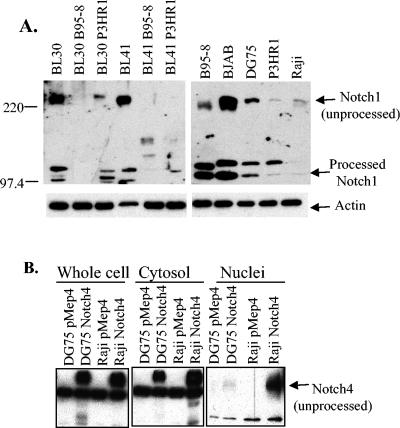
FIG. 5.
Notch levels in EBV-positive and -negative cell lines. (A) A series of EBV-positive and -negative cell lines were used for immunoblot analysis. α-Notch1 was used to detect endogenous Notch1 (top panel), and α-β-actin was used as a loading control (bottom panel). (B) DG75 and Raji cells stably expressing myc-tagged Notch4 were fractionated into cytosolic and nuclear lysates and used for immunoblot analysis. α-cMyc was used to detect Notch4.

