
FIG. 4.
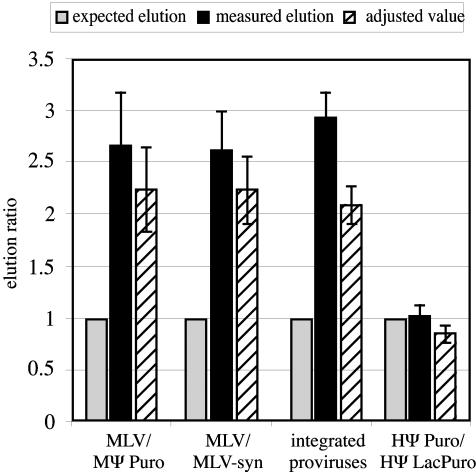
Summarized elution data from RNA capture experiments. Open bars, average expected elution ratio; filled bars, average measured elution ratio; hatched bars, average elution ratios corrected for the assumption that twice as many oligonucleotide-bound homodimers as heterodimers are retained on the beads. Standard errors are indicated. For comparison among experiments, expected elution ratios were set to a value of 1 (1 oligonucleotide-bound RNA/1 unbound RNA), and measured elution ratios were normalized accordingly. Thus, the higher the value on the y axis, the lower the amount of unbound RNA relative to values predicted based on random dimerization, and the higher the experimentally determined bias toward preferential RNA homodimerization. Input RNA ratios for the experiments used to generate these data were as follows: 1:6.5,1:4.9, 1:3.6, and 1:3.1 MLV to MΨ Puro for the four repetitions averaged in MLV-MΨ Puro experiments; 1:3.2,1:5.4, 1:5.6, and 1:8.5 MLV to MLV-syn for the four repetitions used to generate the MLV-MLV-syn data; 1:1.8, 1:5.6, 1:4.8, and 1:7.1 HΨ Puro to HΨ LacPuro for the four repetitions averaged in HΨ Puro-HΨ LacPuro experiments; and 1:1.3, 1:1.6, 1:1.5, 1:1.4, and 1:1.5 MLV-GPP to MLV-syn for the five repetitions used to generate the data from MLV-GPP-MLV-syn-coexpressing cells.