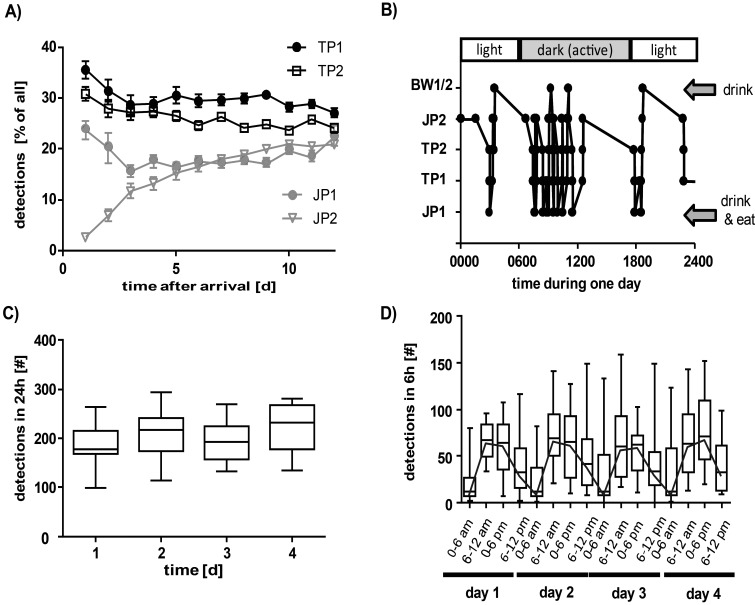
Figure 8.
Automated tracking of spontaneous motion of individual rats housed in a colony cage. (A) Habituation period of 150- to 200-g Lister Hooded rats in a colony cage after breeding and rearing in conventional plastic cages. Data are shown as the percentage of detections at the single tracking stations relative to other stations over the first 25 d. (B) Example of the path of a rat (8-wk habituated Lister Hooded rat) through a colony cage over 24 h. Consecutive detections at the same station have been filtered out, and only sequential moves to a different station are shown (data in panels A, C, and D are not filtered). (C) Total number of detections at all 6 stations in 24-h intervals over 4 d without disturbance (weekend and holidays after 11 wk of habituation). Data are shown as the median, minimum, and maximum of 18 rats. (D) Total number of detections at all 6 stations in 6-h intervals (same rats as in panel C). The black line connects median values to demonstrate circadian rhythmicity.

