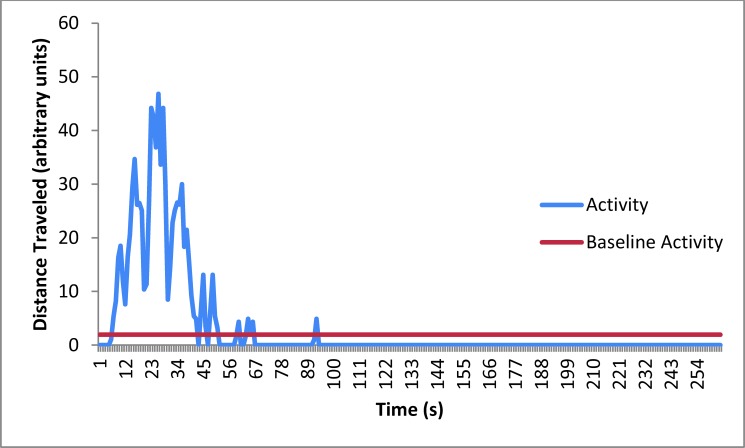
Figure 4.
Mean activity of mice (n = 10) at baseline and during isoflurane euthanasia. The amount of time during which the mice were active, the distance they traveled (that is, peak height), and the percentage of each compared with the total time that the mice were active are presented in the Results section.

